この地図を1/11から3/31まで連続画像にしてみました。日々の変化を
時系列で追いかけると、見えないものが見えてきます。
https://vdata.nikkei.com/newsgraphics/coronavirus-world-map/
これがデータの出典元です
わかお かずまさ
VegaSystems
Please fill in the below form to get in contact with me. Subject and message fields are required.
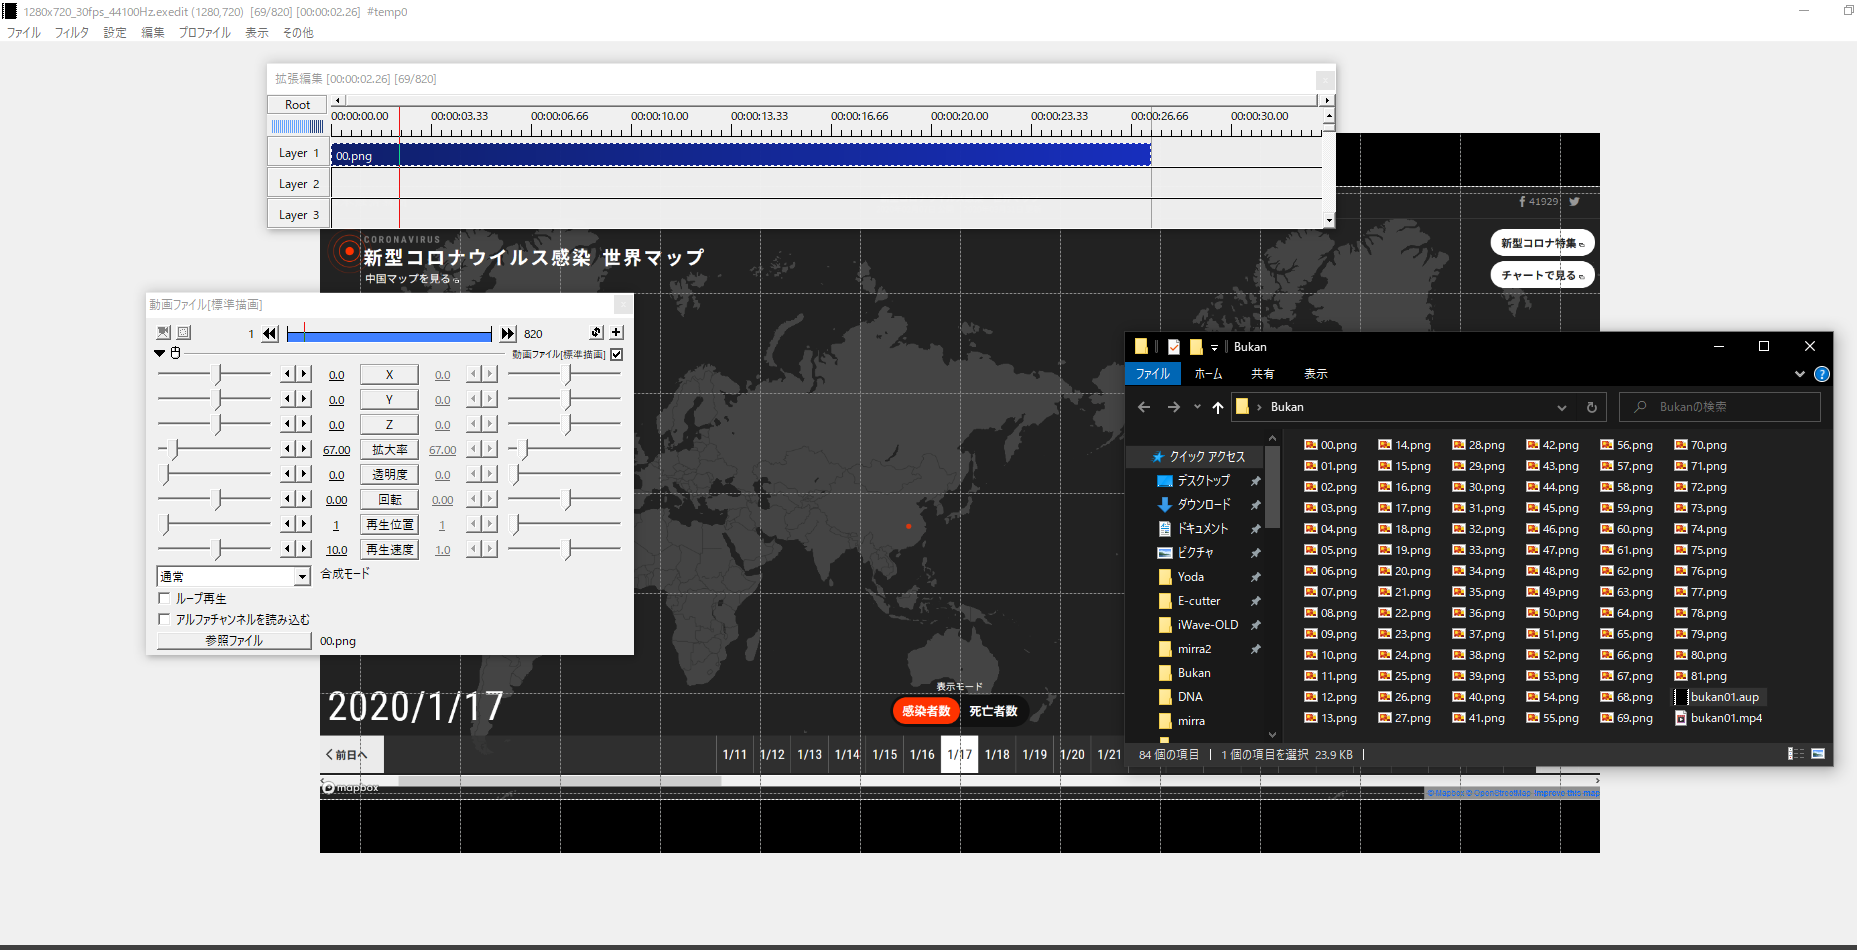 日々のデータをキャプチャーし、それをリネームして